Note
Go to the end to download the full example code.
Extract Grain Features#
Import data#
Extract grain id, completeness and voxel spacing from the result file
from gm3dh5.file import GM3DResultFileReader

with GM3DResultFileReader("example.h5") as f:
    spacing_in_um = 1000 * f.spacing[0]
    grainids = f.grainids
    completeness = f.completeness
Extract Features#
first, import additional dependencies
import matplotlib.pyplot as plt
import numpy as np
from skimage.measure import regionprops_table
secondly, extract some features
props = regionprops_table(
    grainids,
    completeness,
    properties=(
        "label",
        "centroid",
        "area",
        "solidity",
        "axis_major_length",
        "axis_minor_length",
    ),
    spacing=spacing_in_um,
)
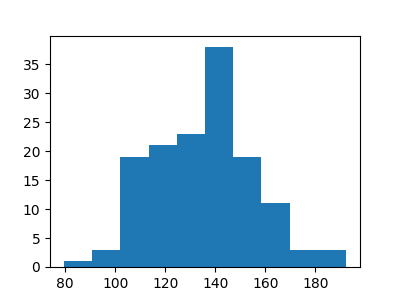
Calculate the equivalent spherical diameter from the area property
Plot the grain size distribution
plt.figure(figsize=(4, 3))
_ = plt.hist(esd)
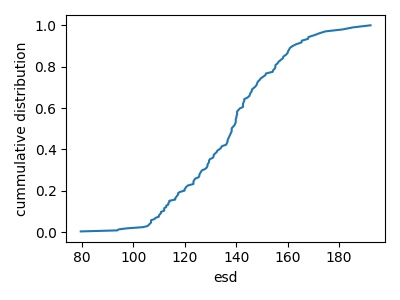
Plot the cumulative grain size distribution
esd_sorted = np.sort(esd)
plt.figure(figsize=(4, 3))
plt.plot(esd_sorted, np.cumsum(esd_sorted) / np.sum(esd_sorted))
plt.xlabel("esd")
plt.ylabel("cummulative distribution")
plt.tight_layout()
plt.show()
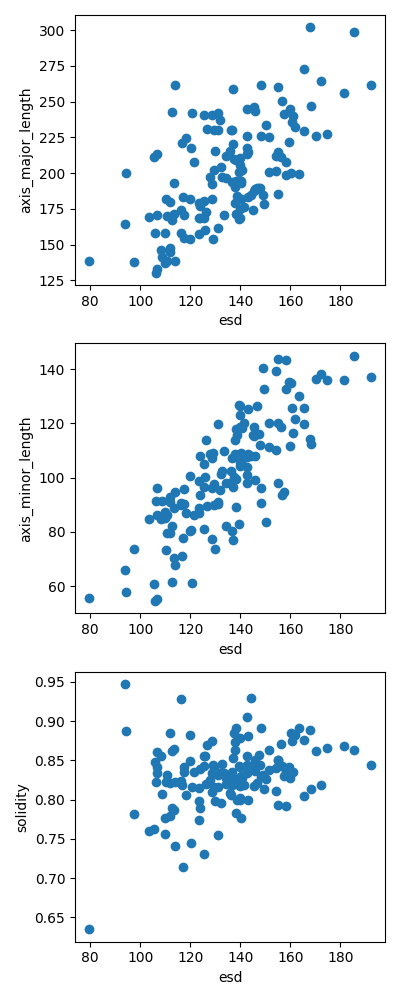
plot grain size vs. grain shape parameters
plt.figure(figsize=(4, 10))
plt.subplot(3, 1, 1)
plt.scatter(esd, props["axis_major_length"])
plt.xlabel("esd")
plt.ylabel("axis_major_length")


plt.subplot(3, 1, 2)
plt.scatter(esd, props["axis_minor_length"])
plt.xlabel("esd")
plt.ylabel("axis_minor_length")

plt.subplot(3, 1, 3)
plt.scatter(esd, props["solidity"])
plt.xlabel("esd")
plt.ylabel("solidity")
plt.tight_layout()
plt.show()
Total running time of the script: (0 minutes 0.587 seconds)